
Automotive example
What is statistical process control?
Statistical process control consists in a set of statistical tests performed on a process (for example a production line). Its goal is to:
- Keep under control the quality of a process
- Preventing errors
- Reducing costs for problems occurring on the units coming out from a process (or a production line)
SPC techniques evaluate the variability of a process, so to identify the probability of non-conformities.
Example:
A car production line has critical bolts, tighten by power tools (electric tools, pneumatic tools, wrenches). A proper tightening process is vital to assure the quality of the cars.
With thousands of screws too be tighten every day, how can the quality be assured?
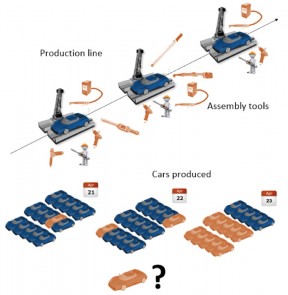 In case of an error, how can we know what happened in the cars already produced?
Machine capacity (Cm, Cmk) and process capacity (Cp, Cpk)
- Cm e Cp
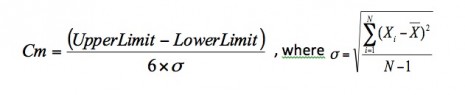
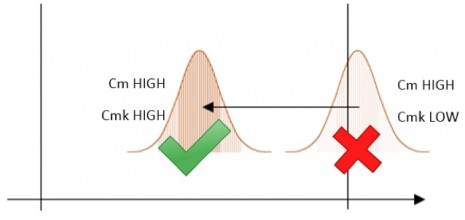
The Cm index is the machine capability; it is the number of times the spread of the machine fits into the tolerance width. The higher the value of Cm, the better the machine.
The Cp has the same meaning, but it is applied to a process instead of a machine.
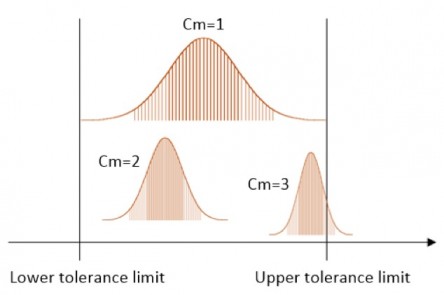
The Cm and Cp describe the repeatability of a machine or process for the given tolerance class, regardless the fact that they are center on the target value.
- Cmk e Cpk
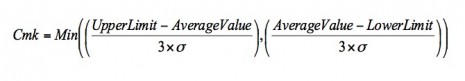
To study the position of the machine or process capability in relation to the target value, you use the Cmk or Cpk index, which evaluate the capability corrected for position.
A high Cmk index means that the machine or process has small spread in relation to the tolerance width, and it is well centered within that width.

- Cm, Cmk and Cp, Cpk interpretation
A good Cm or Cp is fundamental for the machine or process. If the Cm or Cp has a low value, the only way to accept it without repairing the machine or process it to make wider the tolerance interval:

If the Cmk is low but the Cm is high, the machine or process can be within its specification with a simple recalibration:
- Example of measuring Cm, Cmk and Cp, Cpk
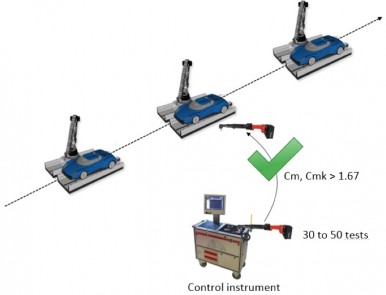
The car manufacturer decides to monitor the Cm, Cmk and Cp, Cpk indexes on its production lines.
Measuring the Cm, Cmk means to test the tightening parameter (torque and angle) of all the assembly tools:

Measuring the Cp, Cpk means to test the result of the process, in this case the residual torque in the joint tighten by the assembly tool:

Control Charts (X, R)
Measuring the Cm/Cmk and Cp/Cpk sometimes requires too much time to be executed daily on a production line.
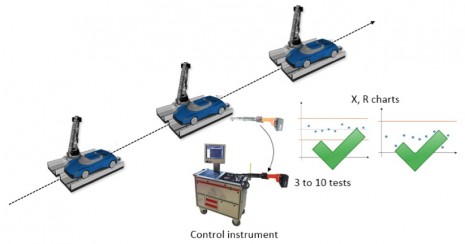
Another powerful tool of the Statistical Process Control is building the control charts, of the basis of frequent tests on few production items. In this way the test can be performed not disturbing the production line, and building day-by-day charts to monitor the process and preventing errors before they arise.
Typically, each set is composed by 3 up to 10 tests. For each set, the average (X) and range (R) points are recorded on the control charts:


Where D2 is a coefficient depending from the number of samples for each set of tests
The control charts gives a picture of the machine or process trend. The machine or process can be inspected/adjusted before it goes out of control. In the following example, the machine or process is still in the specification but it is going out of control:

Example of Statistical Process Control implementation
A car manufacturer decides to implement the SPC on its production line.
- Before adding a new tightening tool to the production line, and then once every month, a Cm-Cmk test is run on the tool:
- Each day, the tool is removed for few seconds from the line, and it is verified trough a statistical control test, to build X,R charts:
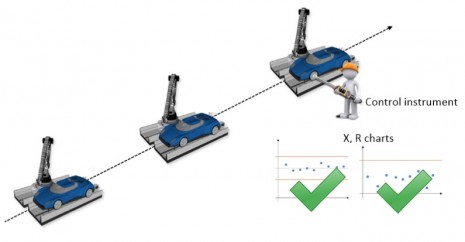
- Each day, residual torque tests are executed at the end of the production line, to verify the process (using Cp-Cpk and/or X,R charts):
- All the results of the Cm-Cmk, Cp-Cpk, X,R charts are stored in a database for analysis, traceability and reporting:

